Dashboards
The dashboard provide basic mechanism for displaying data via bar or pie charts.
Integration with statsd
Each graph can push data to statsd. You must add STATSD_GRAPHS_PREFIX to yours settings and set ALLOW_PUSH_GRAPHS_DATA_TO_STATSD and COLLECT_METRICS to True. Next, check Push to statsd on concrete graph and use Ralph's management command push_graphs_to_statsd to push your data to statsd.
Getting started
All example data in this tutorial was generated by Ralph's command - ralph make_demo_data.
Goal
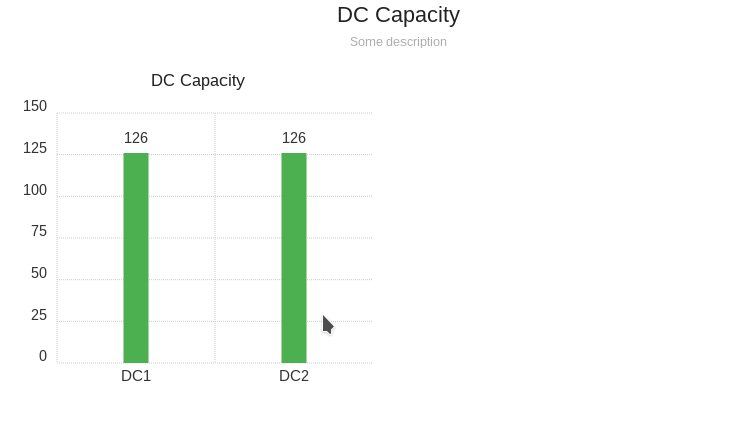
Display graphs with quantity assets in each data centers.
First dashboard
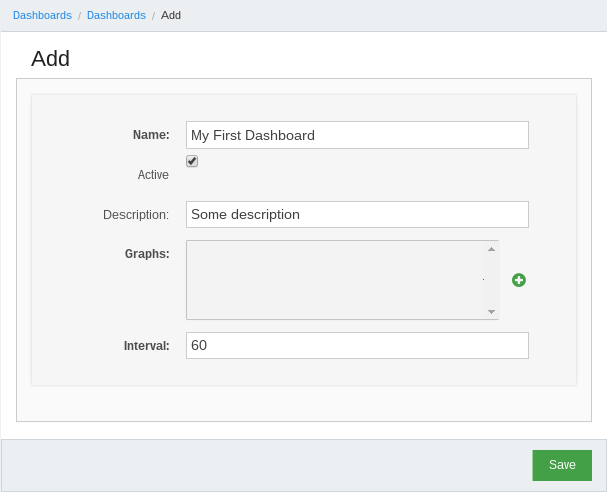
First of all we must create new dasboard object in Ralph by clicking in menuDashboards > Dashboards next click Add new dashboard to add new one.

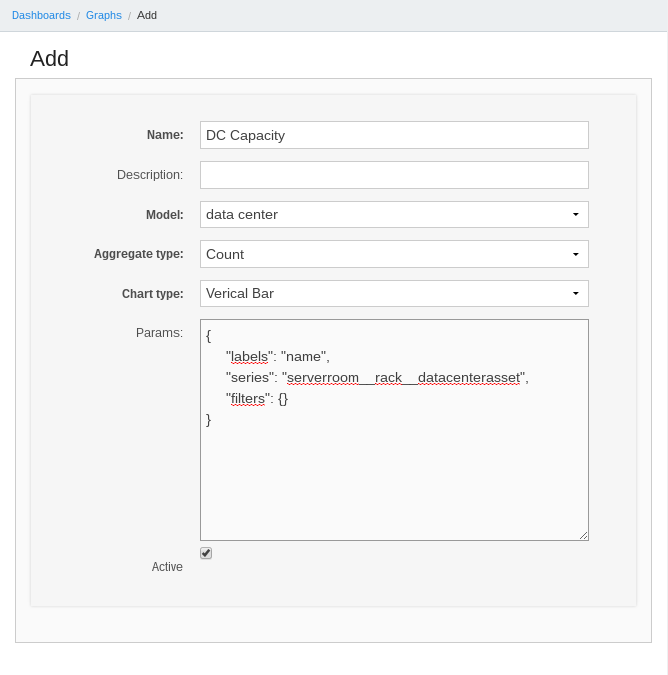
Next steps is create graph and configure it.

The important field of form above is Params - this field accepted configuration of graph in JSON format. Keys labels, series, filters are required.
Below short description of these fields:
labels- which field in model are string representation,series- aggregate by this field,filters- filter query by conditions, Django ORM-like lookup (visit Django documentation for more information),excludes- excludes items from results - opposite tofilters,aggregate_expression- by default isseries, you can override this value by correct aggregate expression (e.g.*or path to field),target- contains keys:model,filter,value; this options changes default view for clickable graph.
OK, after save go our new dashboard object. Now we can see item (DC Capacity) in Graphs fields - select them. After save go to Dashboards > Dashboards in list view click Link.

Final result:

Aggregating options
distinct
series allows for aggregating by distinct value. To use it, extend series query using |distinct modifier:
{
    "labels": "name",
    "series": "serverroom__rack|distinct",
    "filters": {
        "series__lt": 5
    },
}
Ratio
series allows for calculating ratio of two aggregated fields. Set Aggregate type of graph to Ratio and use list
of two values for series:
{
    "labels": "service_env__service__name",
    "series": [
        "securityscan__is_patched",
        "id"
    ]
}
Grouping by date
series allows for aggregating based on part of the date, like year or
month:
{
    "labels": "service_env__service__name",
    "series": "created|year",
}
Special filters and fields
Special filters are some helpers to
series
series is special field which contains all annotated values and can be filtering like other fileds:
{
    "labels": "name",
    "series": "serverroom__rack",
    "filters": {
        "series__lt": 5
    },
}
or, and
or, and extend query about extra condition, e.g.:
{
    "labels": "name",
    "series": "serverroom__rack",
    "excludes": {
        "name__exact|or": [null, ''],
    },
}
Filters accept as a argument list of elements.
from_now
from_now works only with date and date-time fields in filters section, e.g.:
{
    "labels": "name",
    "series": "serverroom__rack__datacenterasset",
    "filters": {
        "created__gt|from_now": "-1y",
    },
}
The filter above limit query to objects which created from one year ago to now. Possible variants of period:
y- years,m- months,d- days,
REST API
You can also fetch data via REST API. Examples:
# get all graphs
curl https://<YOUR-RALPH-URL>/api/graph/ | python -m json.tool

# get details of graph
curl https://<YOUR-RALPH-URL>/api/graph/1/ | python -m json.tool
All endpoints are read only.